Bumped by Community user
added 283 characters in body
Source Link

I want to create a scatterplot in Google sheets with multiple datasets, and yet still be able to add data labels for each data point. Additionally, it's two independent axis, which means some X values will have multiple Y values.

Example sheet: This sheet is almost what I want, except I want data labels to show up beside each point and I also want to do multiple different color datasets on the same plot. https://docs.google.com/spreadsheets/d/1EZ78WNVvvpggP8L52H-yuh-ICJEkd9XCOrX752nHw1I/edit?usp=sharing

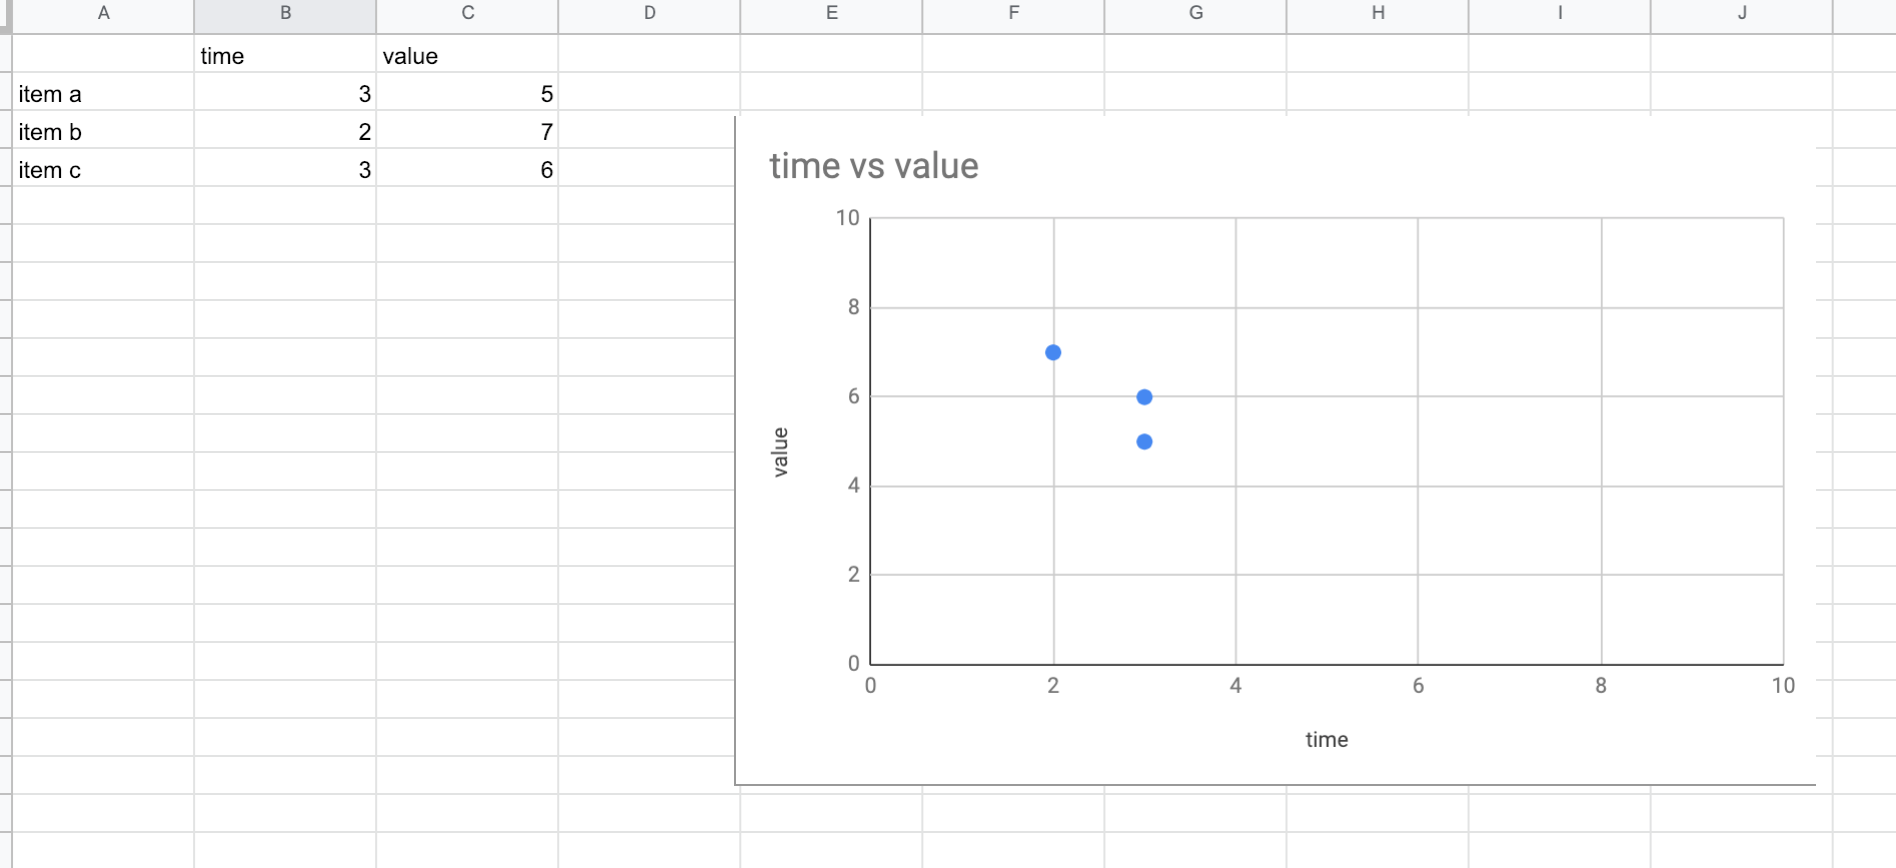
enter image description here

I want to create a scatterplot in Google sheets with multiple datasets, and yet still be able to add data labels for each data point. Additionally, it's two independent axis, which means some X values will have multiple Y values.

Example sheet: This sheet is almost what I want, except I want data labels to show up beside each point and I also want to do multiple different color datasets on the same plot. https://docs.google.com/spreadsheets/d/1EZ78WNVvvpggP8L52H-yuh-ICJEkd9XCOrX752nHw1I/edit?usp=sharing

enter image description here

added 283 characters in body
Source Link

I want to create a scatterplot in Google sheets with multiple datasets, and yet still be able to add data labels for each data point. Additionally, it's two independent axis, which means some X values will have multiple Y values.

Example sheet: This sheet is almost what I want, except I want data labels to show up beside each point and I also want to do multiple different color datasets on the same plot. https://docs.google.com/spreadsheets/d/1EZ78WNVvvpggP8L52H-yuh-ICJEkd9XCOrX752nHw1I/edit?usp=sharing

I want to create a scatterplot in Google sheets with multiple datasets, and yet still be able to add data labels for each data point. Additionally, it's two independent axis, which means some X values will have multiple Y values.

I want to create a scatterplot in Google sheets with multiple datasets, and yet still be able to add data labels for each data point. Additionally, it's two independent axis, which means some X values will have multiple Y values.

Example sheet: This sheet is almost what I want, except I want data labels to show up beside each point and I also want to do multiple different color datasets on the same plot. https://docs.google.com/spreadsheets/d/1EZ78WNVvvpggP8L52H-yuh-ICJEkd9XCOrX752nHw1I/edit?usp=sharing

edited body; edited title
Source Link
serenesat
  • 10k
  • 30
  • 33
  • 50

google Google sheets, scatter plot, multiple datasets, with datapoint labels

I want to create a scatterplot in googleGoogle sheets with multiple datasets, and yet still be able to add data labels for each data point. Additionally, it's two independent axis, which means some X values will have multiple Y values.

google sheets, scatter plot, multiple datasets, with datapoint labels

I want to create a scatterplot in google sheets with multiple datasets, and yet still be able to add data labels for each data point. Additionally, it's two independent axis, which means some X values will have multiple Y values.

Google sheets, scatter plot, multiple datasets, with datapoint labels

I want to create a scatterplot in Google sheets with multiple datasets, and yet still be able to add data labels for each data point. Additionally, it's two independent axis, which means some X values will have multiple Y values.

Source Link
Loading