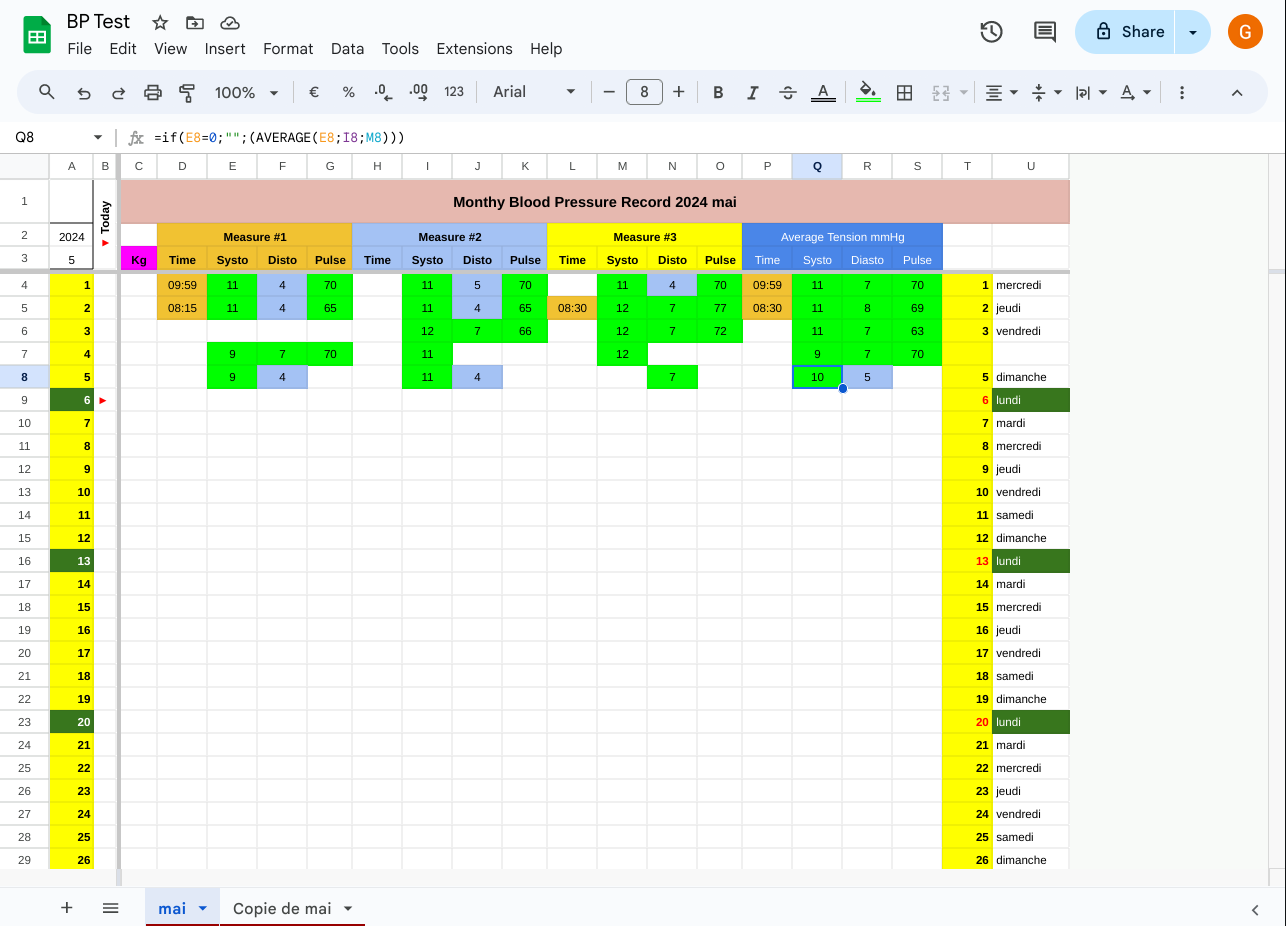
I record my BP results daily Time, Systo, Dysto & Pulse in a google sheet but only one result per day (I calculate the average mentally for each if more than one is done). Thinking about your question, as in my case, I would set up a line for each day in the month (and a tab for each for each month) and set up 4 columns x 3 across the row, the 4th set being the calculation of the average (using Average() of the previous 3 corresponding sets of columns. Very easy to do and use Conditional Formatting to identify ranges eg (for pulse) blue <60 green 60-80 brown 81-90 and red >91
This is a screenshot of my initial thoughts on resolving your question.

When duplicating a tab, cell A2 contains the year and cell A3 the month number (january =1, December =12) these are currently set in my language (France) so the days of the week and month names reflect such but this can be changed of course by selecting File > Settings and changing the Locale as required. The Today flag is useful for identifying which line to use and is set by reference to cells A2 & A3 and the cell which contains the day number of the month. In the example shown I have used Conditional Formatting to highlight Mondays for ease of navigating the sheet.

If you want to see the original so that you can check it out, let me know and I can upload a link to the blank sheet maker created from my test sheet where you can copy it to your own system.


