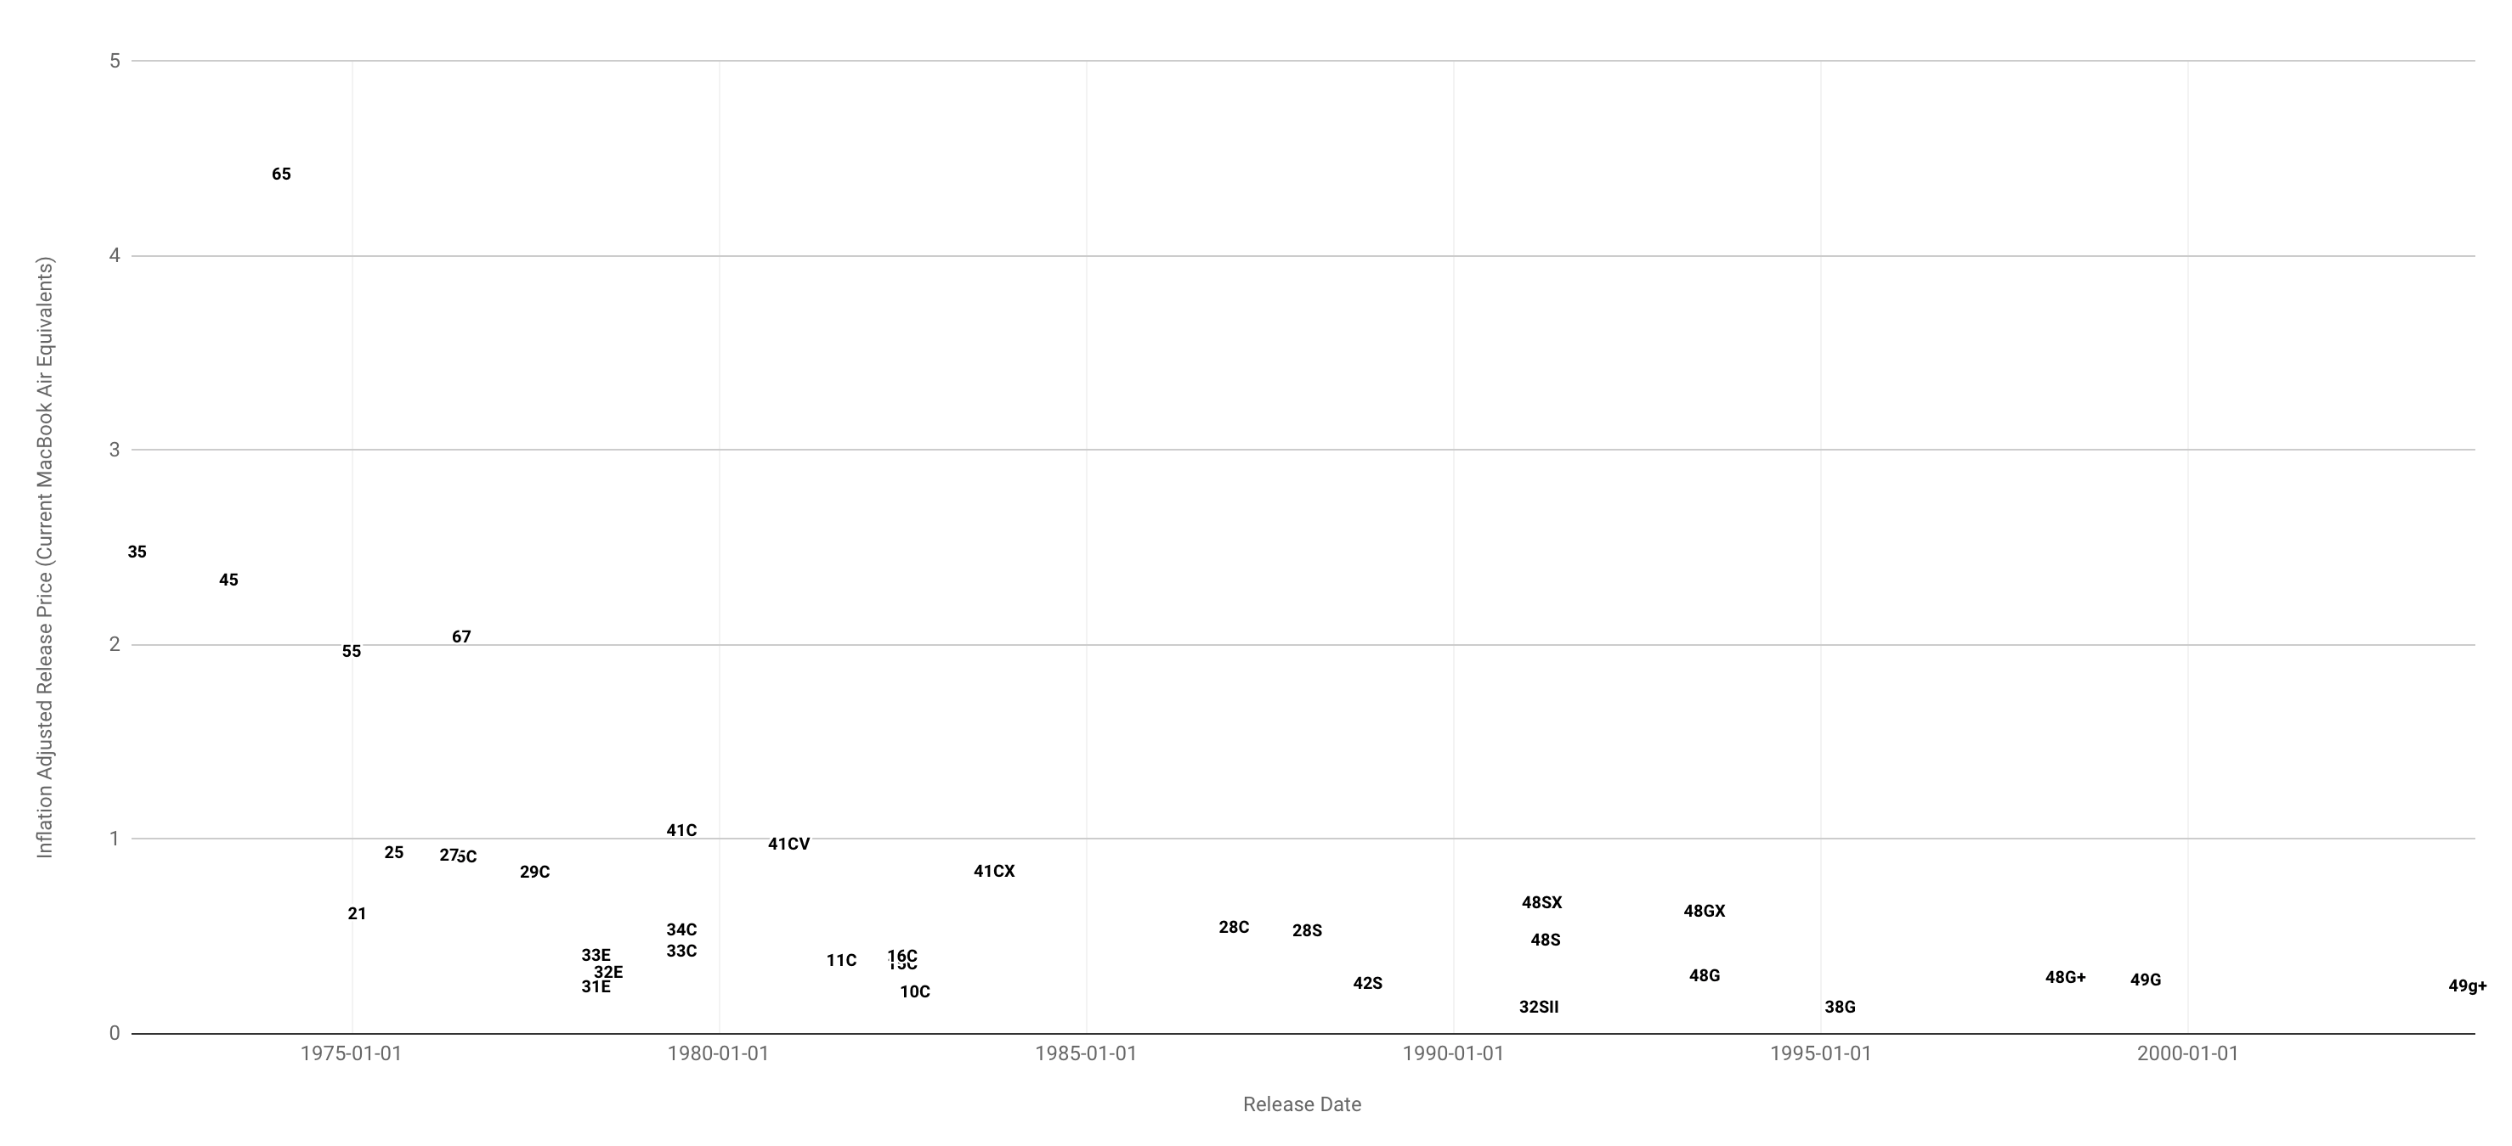
The settings for the vertical axis on a Google Sheets scatter plot provide an option for selecting or customizing a format for the labels, but no corresponding option is provided for the horizontal axis.
For example in the following chart, I have successfully changed the default decimal formatting on the vertical axes to integers, but can't change the "YYYY-MM-DD" formatting on the horizontal axis to simply "YYYY":
How do I format the horizontal axis labels on a Google Sheets scatter plot?

