Bumped by Community user
deleted 2 characters in body
Source Link
serenesat
  • 10k
  • 30
  • 33
  • 50

I couldn't think of a better title, but here's what I have:

I want a graph of X and Y, but when there's multiple Y values for an X value, I want it to plot the average of the Y values.

Here's what I've tried:

I noticed that if I have two identical X,Y pairs, the graph will show them as a single point - so if I can create a column that averages out the Y values for the same X, I can graph that and get what I want (although I haven't been able to do that either).

Source Link
Dr-Bracket
  • 213
  • 1
  • 2
  • 7

Google Sheets: Average data points with same X value

I couldn't think of a better title, but here's what I have:

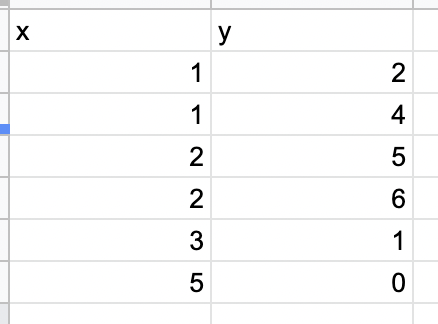
I want a graph of X and Y, but when there's multiple Y values for an X value, I want it to plot the average of the Y values.

Here's what I've tried:

I noticed that if I have two identical X,Y pairs, the graph will show them as a single point - so if I can create a column that averages out the Y values for the same X, I can graph that and get what I want (although I haven't been able to do that either).