0

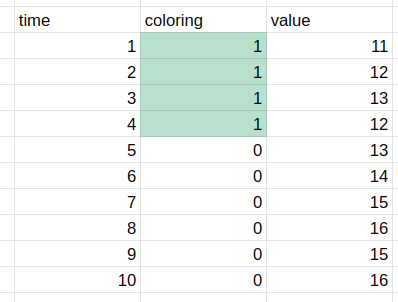
Imagine I have a table like the following.
enter image description here

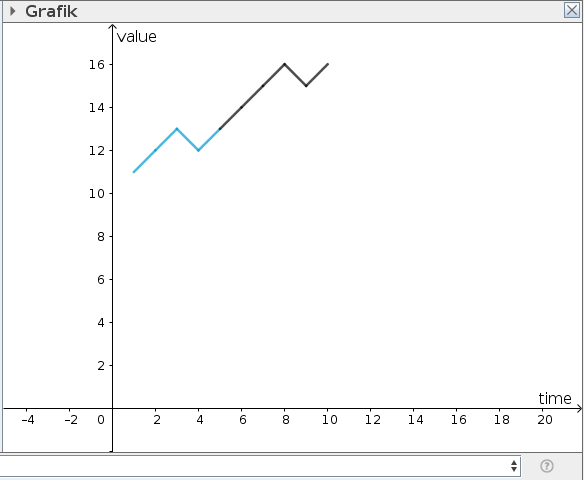
Column A is the x-axis, e.g. time. Column B is some condition, e.g. 1 and 0 for yes and no or true and false. Column C has the y-values. I'd like to create a line chart that changes color depending on Column B, as in the following Figure (made manually in GeoGebra).

enter image description here

However, I have absolutely no clue and cannot find anything. Perhaps I am looking for the wrong words.

1
  • 1
    I uploaded a pictture! Thanks for looking at the problem Commented Mar 14, 2023 at 15:11

1 Answer 1

1

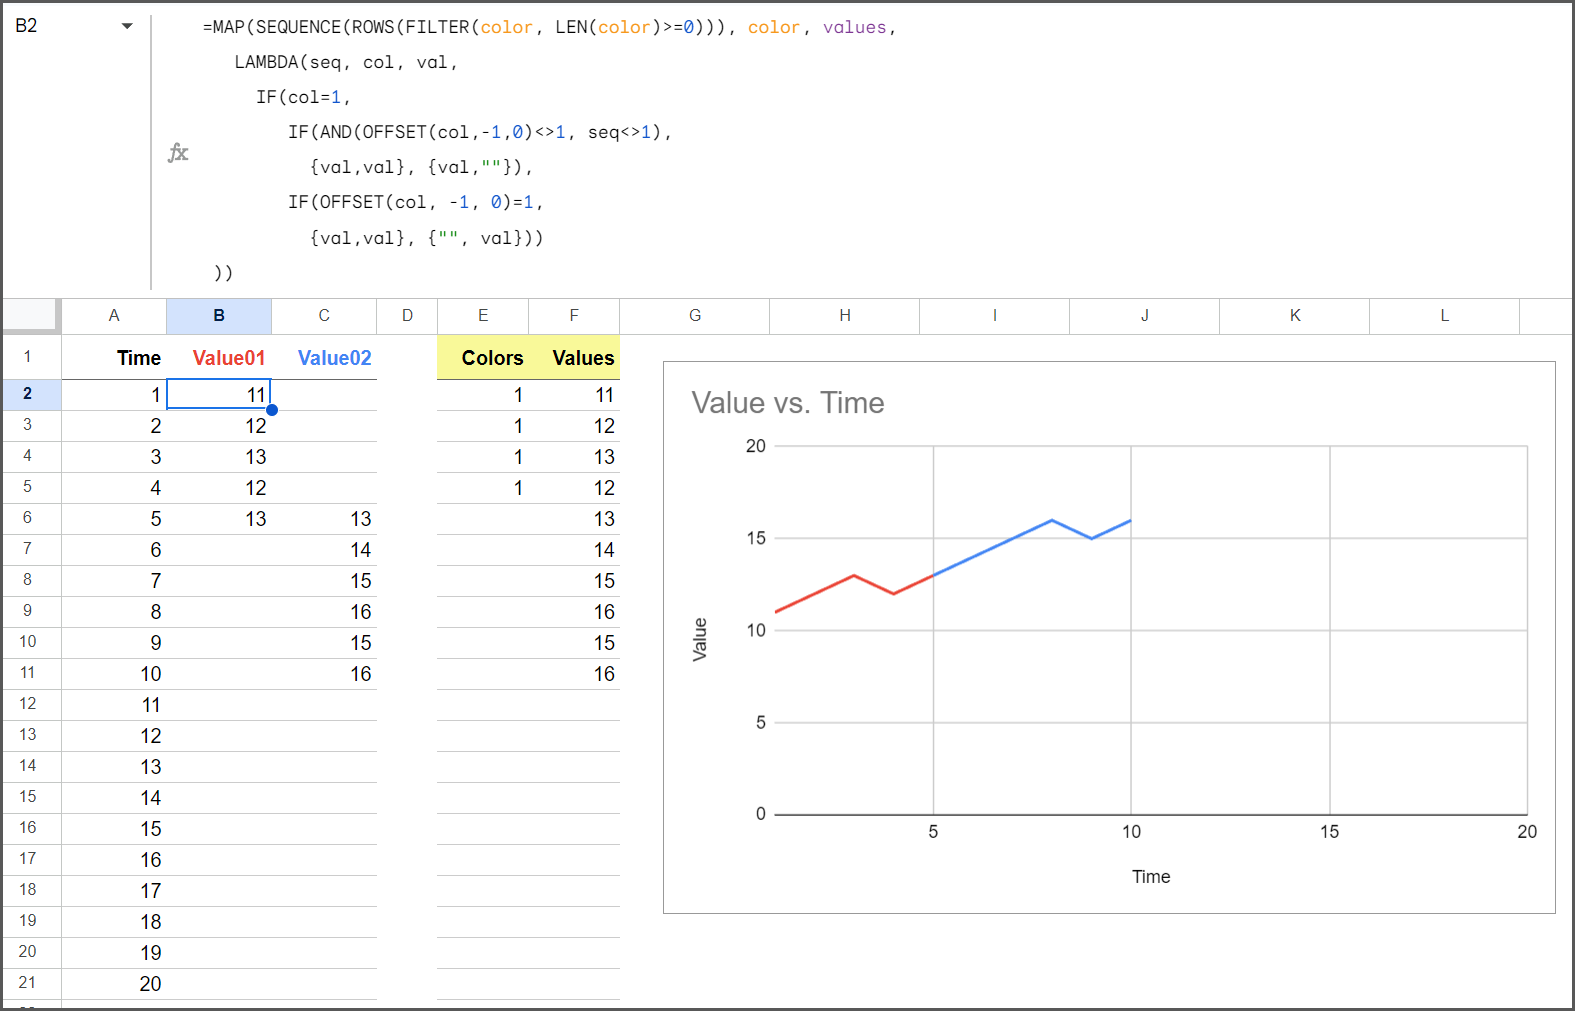
Formula in B2

=MAP(SEQUENCE(ROWS(FILTER(color, LEN(color)>=0))), color, values,
   LAMBDA(squ, col, val, 
     IF(col=1, 
        IF(AND(OFFSET(col,-1,0)<>1, squ<>1),
          {val,val}, {val,""}),
        IF(OFFSET(col, -1, 0)=1,
          {val,val}, {"", val}))
 ))

Named Ranges

Name Range Notes
color E2:E21 Holds the color flags: =1 or <>1)
values F2:F21 Contains all the entered values

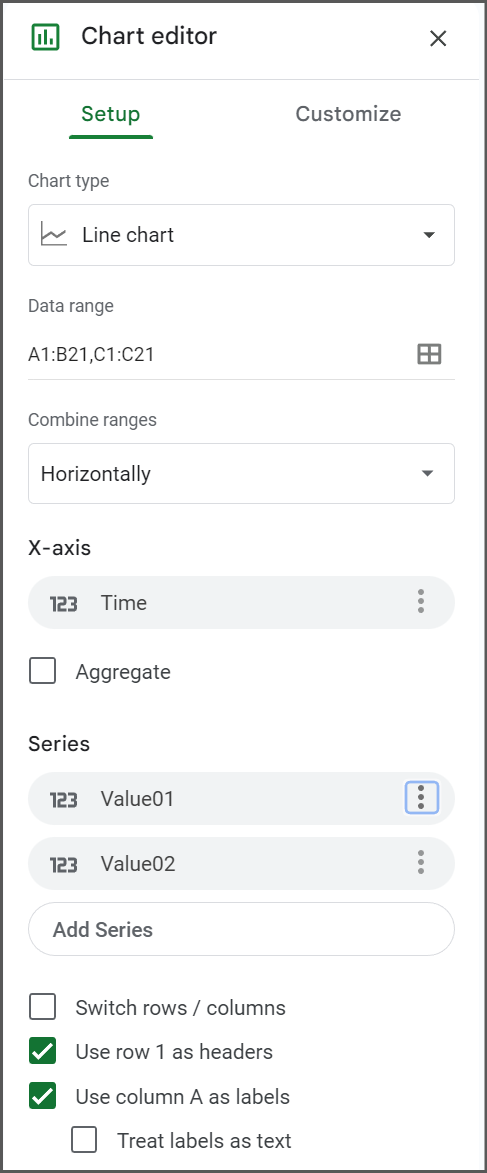
Chart Customizations

Section Customization
Setup > Chart type Line chart
Setup > Data Range A1:B21,C1:C21
Setup > Combine ranges Horizontally
Setup > X-axis Time
Setup > Series


Value01
Value02

✔️ Use row 1 as headers
✔️ Use column A as labels
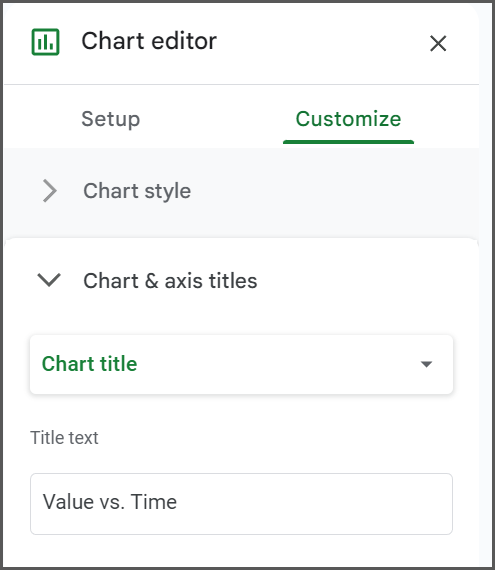
Customize > Chart & axis titles
                            > Chart title > Title text
 
Value vs. Time
Customize > Legend > Position None


Note: I repurposed this chart in another related solution asking about alternating background colors.

Your Answer

By clicking “Post Your Answer”, you agree to our terms of service and acknowledge you have read our privacy policy.

Not the answer you're looking for? Browse other questions tagged or ask your own question.