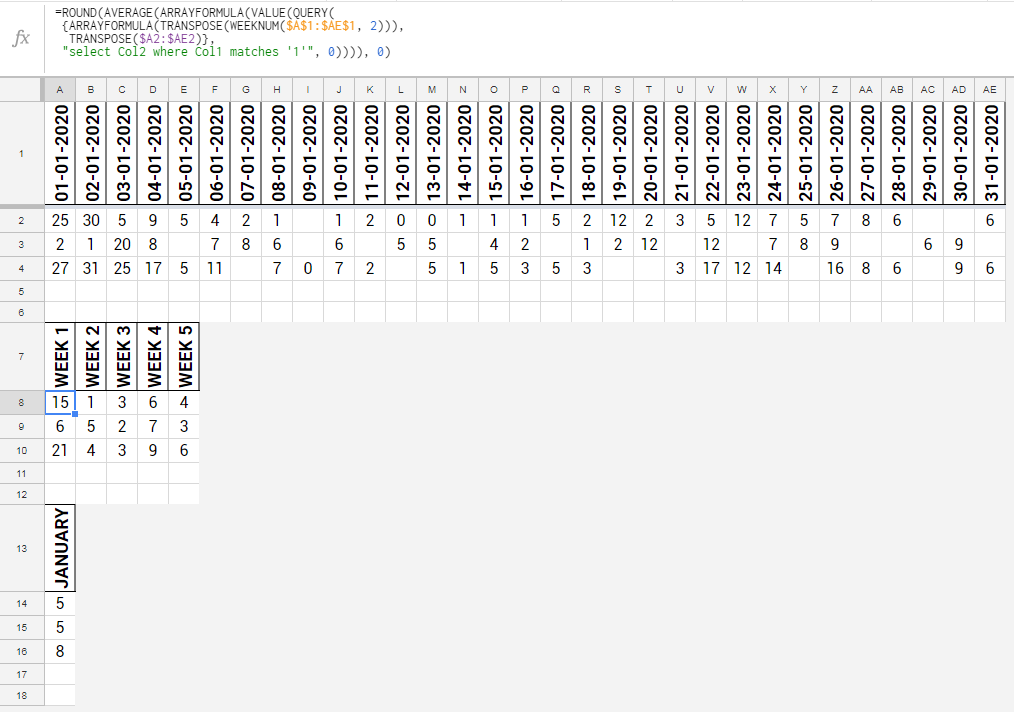
Is there a way to convert daily values into weekly averages for charting?
Sample source sheet
---------------------------------------------------
| Data 1 | 1/1/2018 | 1/2/2018 | 1/3/2018 | etc...365 days |
---------------------------------------------------
| row 1  |    25    |   30     |    5     | etc...|
---------------------------------------------------
| row 2  |    2     |          |    4     | etc...|
---------------------------------------------------
| etc ... each row has a different cadence.
Except for, each row may not have values daily, but rather weekly or monthly, depending on the cadence. So I would like to use the query function to aggregate some rows as weeks, and some rows as the month.
Expected results for a weekly aggregate (if there is more than 1 value I just want the avg for the week, IE: if in a week there are values: 2,3,3, simply show: 2)
---------------------------------------------------
| Data 1 | Week 1 | Week 2 | Week 3 | etc...52 weeks |
---------------------------------------------------
| row 1  |    25  |   30   |    5   | etc...|
---------------------------------------------------
| row 2  |    2   |   0    |    4   | etc...|
---------------------------------------------------
| etc ...
for a monthly aggregate (if there is more than 1 value I just want the avg for the month, IE; if in a month there are values: 25,50,100, simply show: 58)
---------------------------------------------------
| Data 1 | Jan | Feb | Mar | etc...12 months |
---------------------------------------------------
| row 1  | 50  | 30  |  55 | etc...|
---------------------------------------------------
| row 2  | 2   |  0  | 4   | etc...|
---------------------------------------------------
| etc ...
This way, I can create graphs showing the correct unit of measure (week, month, etc). How could I convert?

