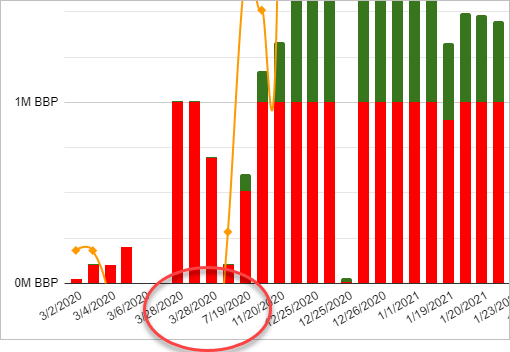
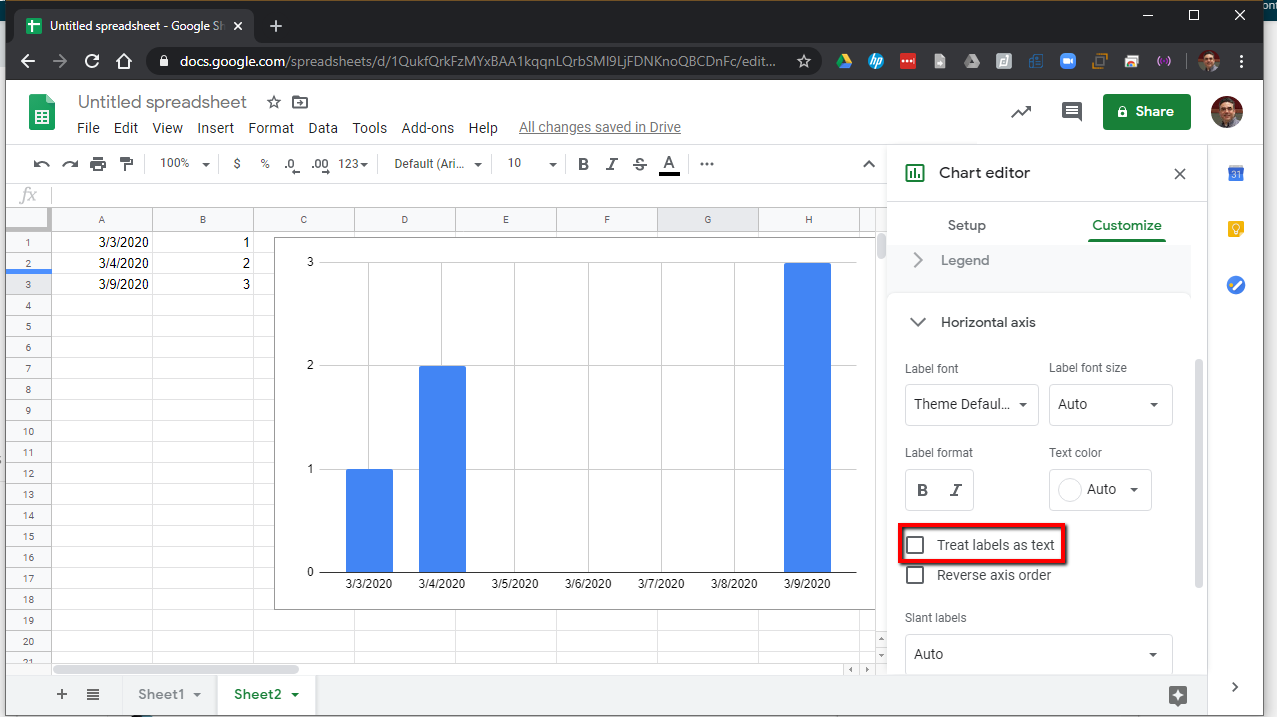
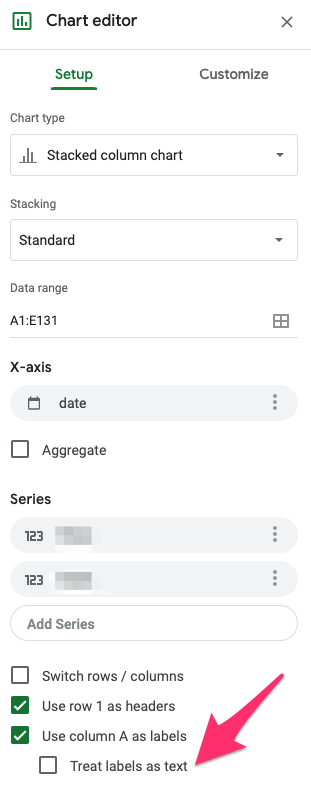
I made a combo chart where the x-axis is the date field. I have gaps in the date, but want my chart to reflect the gap. For example, I have big gaps in April, May, June, August, September, and October.
11/20/2020
7/21/2020
7/19/2020
4/30/2020
3/28/2020
3/28/2020
How do I show the x-axis with missing date ranges without altering the data? The data is being imported from a CSV elsewhere which I can not change, only read in.
Edit add:
I am using combo chart
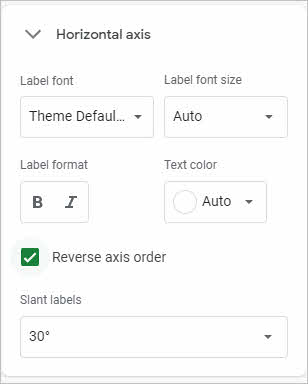
My horizontal axis options look like this:


