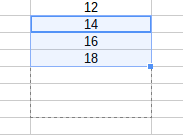
Given a set of values such as: 10, 12, 14, 16, 18 I would like to "estimate" that the next values will be: 20, 22, 24 and so on. I realize there are several different ways to extrapolate, and they will give different results. I'm assuming though that the number of options will be rather limited, so I'm not too picky about which method to use.
-
Sorry for OT, I found your question while looking for quadratic regression and I found the keisan.casio.com/exec/system/14059929550941 site very useful (URL links to linear regression). Unfortunately the extrapolation (forecast) is not provided by the site directly but you get coefficients from which you can easily compute forecasted value yourself. Copypasting from Google sheets into the cell grid is also cool feature.– Tomáš ZáluskýCommented Oct 28, 2018 at 15:50
3 Answers
There are two ways I can think of:
Regression
With the following function, one can retrieve the linear regression coefficients of two sets of data:
LINEST(y-axis,x-axis) ==> y=ax+b
The second set of data is the accompanying x-axis. This can be a normal numbering, as shown in the first sheet of the example file.
Once the regression factors are known, one can extrapolate any unknown x or y beyond the known set of data:
- known x: ax+b
- known y: (-b+y)/a
Since R2=1, the numbers given are exact values. I formatted the values to be rounded in the example, because the calculation shows floating point errors.
Dragging
Google has a way of predicting the outcome of a series, based on that series. If you drag the series like shown in the screenshot, then the outcome will appear automatically:


Example
I've created an example file for you: Extrapolate
A more practical example: https://webapps.stackexchange.com/a/35668/29140
Remark
The regression method will give you always a value, based on the factors. The more un-linear the sets of data are (R2<1), the more predicted they are.
-
Thank you, I'll give it a try. I'm aware of the "dragging" example, and I realize from my simple example that could seem as a viable solution, but I'm working with more complex data in my real sheet. :) Commented Aug 26, 2013 at 20:26
-
@user50849 See the second reference, under example, for a more mixed range. Was my answer helpfull? Commented Sep 7, 2013 at 10:00
-
There is a forecast function built in to Google Spreadsheets that makes this easy to do for simple cases using a linear regression. The docs for forecast are good and clear.
The basic use case is:
FORECAST(x_value_to_forecast,y_axis_set,x_axis_set)
This function combines the steps of calculating the regression coefficients and applying them to the datasets.
if you are here like me and searching for a extrapolation for the google graph / diagramm -> just add a x-value in the range you want to extrapolate in your x-column and leave the y-value blank. the regression will be extrapolated.
