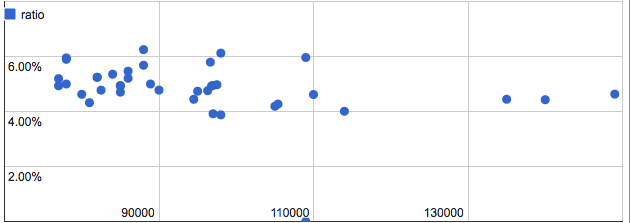
I have the following scatter plot in Google Sheets and I would like to add a line that averages all my points.

Can I do that and if yes, how?
I have the following scatter plot in Google Sheets and I would like to add a line that averages all my points.

Can I do that and if yes, how?
First, calculate the linear regression factors: y=ax+b with the following formula:
=LINEST(B2:B21;A2:A21)
Then add another column next to the y-axis and name it calculated y-axis. Build the following formula to calc. the y-axis and copy that for all x-values.:
=$D$3*A2+$E$3
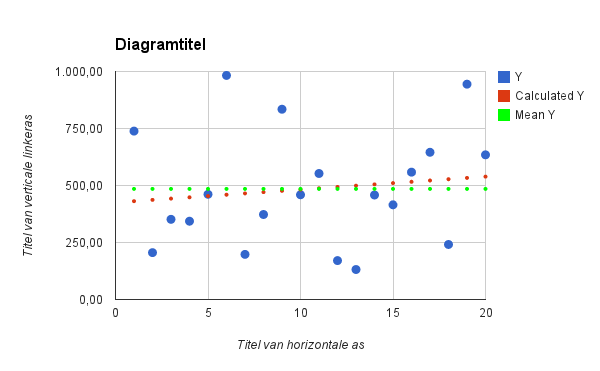
Next is a piece of cake. Add the calculated y-axis to the existing data range or add it seperately.
UPDATE: I've added the calculated mean value as well, in order to be absolutely sure to have answered your question properly, see plot:

See example file for more details: plot regression example