0

Say I have a table like this:

| Date  | Number |
| 0128  | 28800  | 
| 0129  | 32500  | 
| 0130  | 63410  | 
| 0131  | 56400  | 
| 0201  | 68700  | 
| 0202  | 84060  | 

And I can put a graph to show the data.

However, what if I add a new row to the end, I have to re-assign the range of the graph's data to make it redraw.

Is there any way that I can let the graph "know" that I have added a new row?

1 Answer 1

1

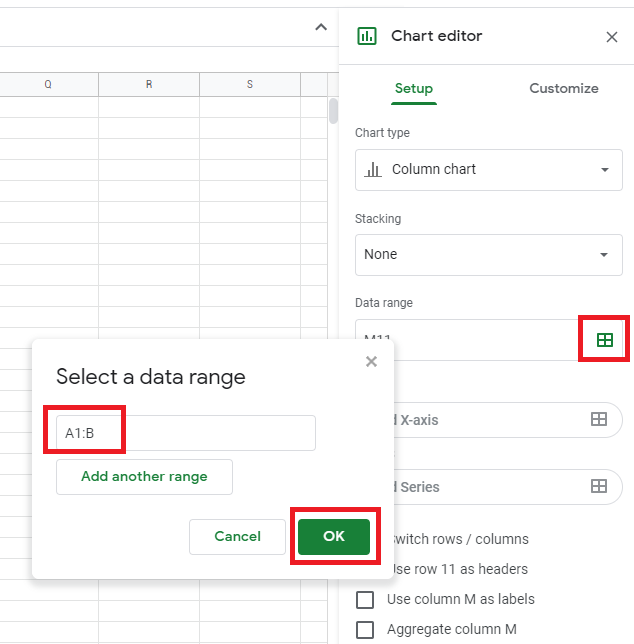
No, there isn't, unless you extend the range. All you need to do is include a bigger range then your data sits on. In your example, your dataset is on the range A1:B7. After you create a chart/graph from this range then click to edit this range and remove the last number so it would be A1:B and click on OK button. This way will chart/graph account for every newly added row in range calculated by chart/graph after you clicked on OK button.

0

Your Answer

By clicking “Post Your Answer”, you agree to our terms of service and acknowledge you have read our privacy policy.

Not the answer you're looking for? Browse other questions tagged or ask your own question.