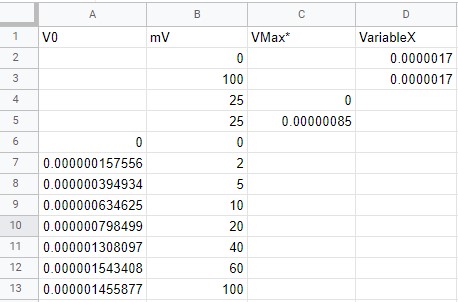
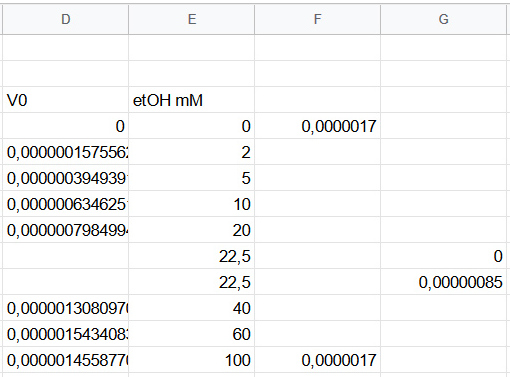
So I am trying to insert a vertical line in my graph in Google Sheets, by following the solution given here:
https://stackoverflow.com/questions/58026200/add-a-vertical-line-to-google-sheet-line-chart
I want the line to go from point 25;0 to point 25;0.00000085, but instead it goes from 0;0 to 2;0.00000085. It's the yellow line in the picture. Could someone help me? I'm losing my mind over this. (In the solution posted above they say that the extra x values should be added at the top of the column but when I do that the graph just gets even more fucked up.)


