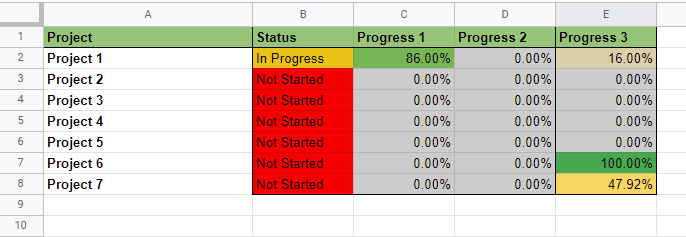
I currently have a project tracker in a Google sheet which records a project name, status character column and three progress columns as below:
I would like to record a daily log of each progress relative to the project so that I have a table recording the following headings automatically: Date, Project 1 Progress 1, Project 1 Progress 2, Project 1 Progress 3, Project 2 Progress 1, Project 2 Progress 2, etc...
I have been able to use the following script to copy one columns daily data to another column, but don't know how to transpose this:
  function recordHistory() {var ss = SpreadsheetApp.getActiveSpreadsheet();
  var sheet = ss.getSheetByName("Sheet1");
  var source = sheet.getRange("C2:C8");
  var values = source.getValues();
  values = [[new Date()]].concat(values);    // prepending the date to values
  sheet.insertColumnAfter(7);                // inserting AFTER column G
  SpreadsheetApp.flush();
  sheet.getRange("G1:G8").setValues(values)
Which I modified from this post: (Automatically record daily values in a new column).
Ideally, I would like to be able to visualize the progress in a graph as well as get some basic stats around how fast we are completing given projects so I can better predict future projects time to completion. I am honestly at a loss and have only just begun working with macros in Google Sheets, so any help you can offer is greatly appreciated, as I'm trying to do this without using R or similar software.

