2

Consider this Google Sheet:

              6/30/2020 1/1/2021    1/1/2022
Consultant    3         4           6
Manager       0         1           1
Administrator 0         0           1   

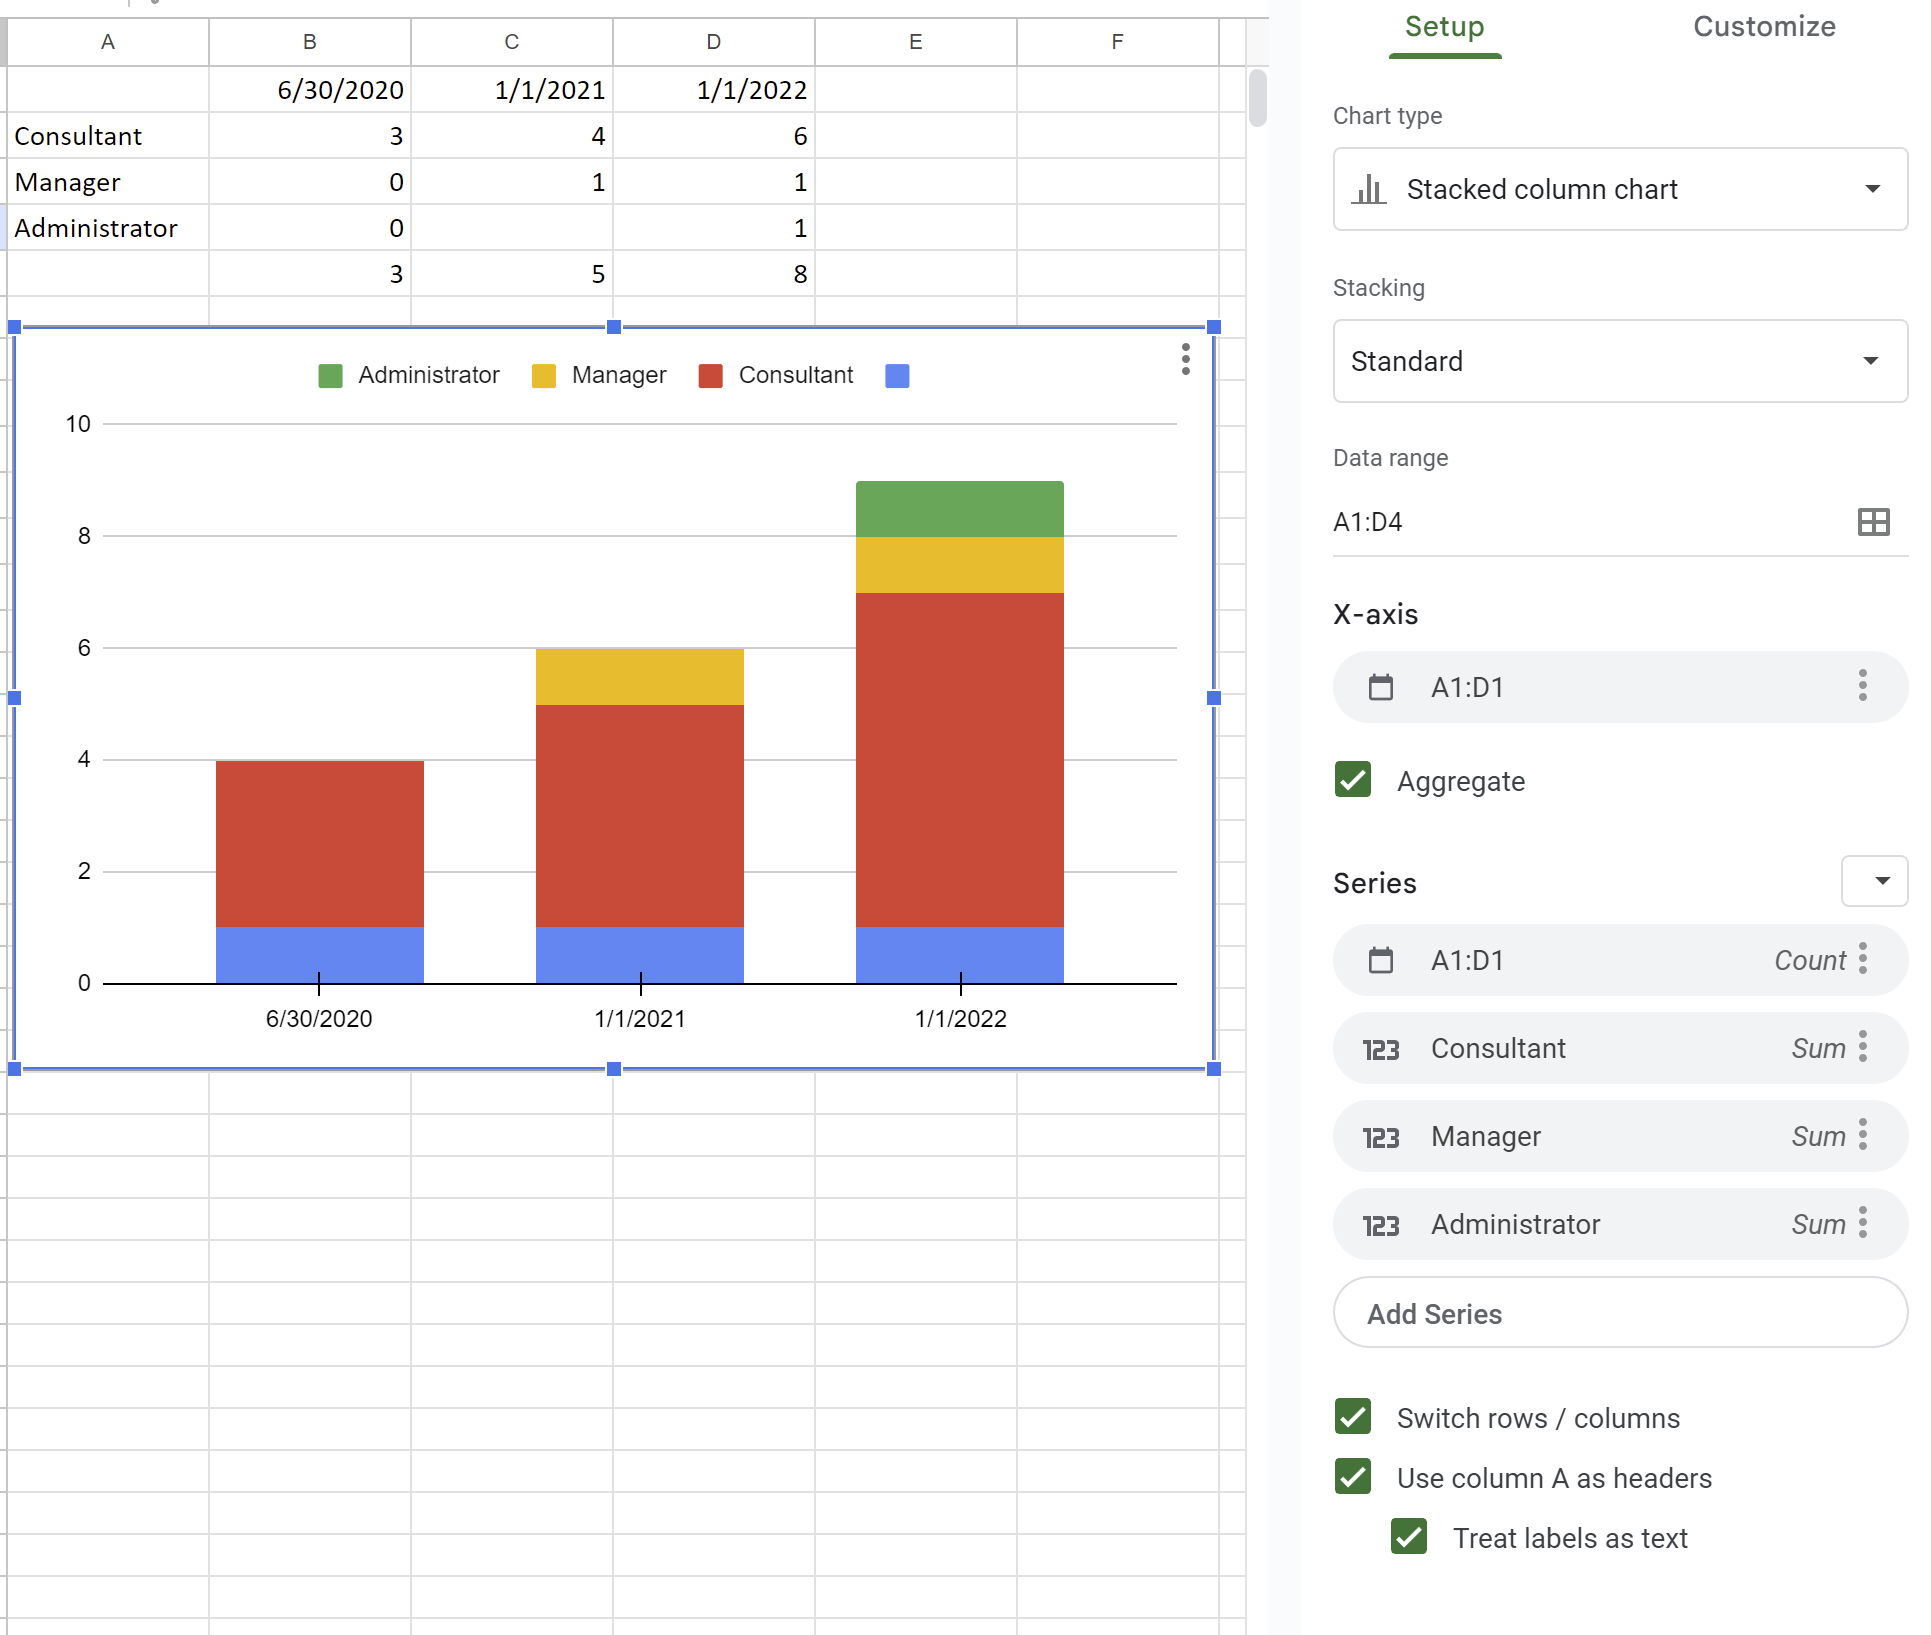
When I create a stacked column chart with data range A1:D4 are there 4 legends somehow.

I have no idea how to get rid of the blue value.

I tried removing A1:D1 series, played around with the settings for that series, but I must leave it at Count to get a stacked chart. See my chart and settings below:

enter image description here

1 Answer 1

2

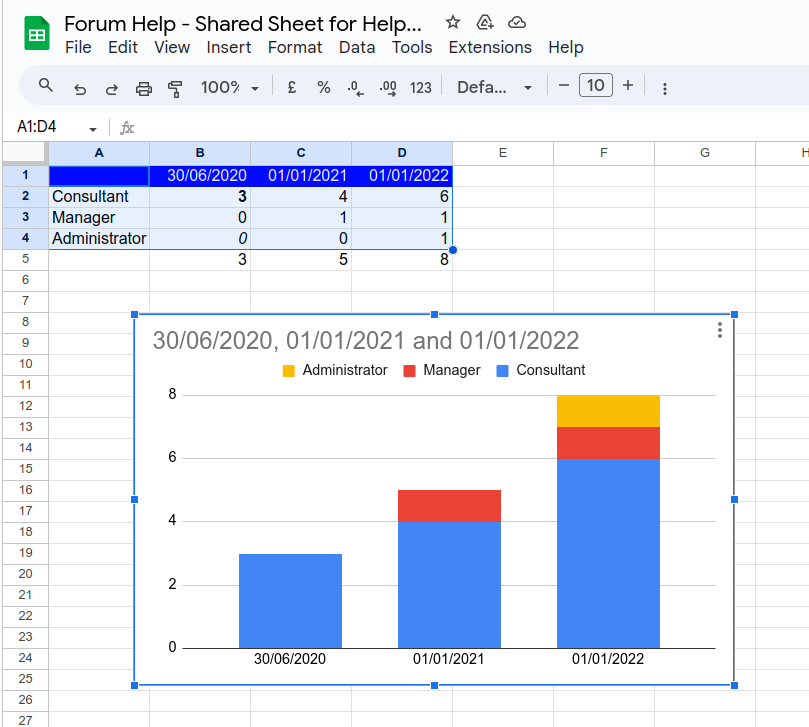
I've not been able to replicate your issue on a new sheet.

However, this Forum Help sheet I created appears to work fine. I selected the same range as you outlined in your question A1:D4

enter image description here

You can go to File > Make a Copy to have a play with it.

https://docs.google.com/spreadsheets/d/1AISXV03Btc9qknp04yXBxcPII3DZIixUjdB9ZmBREO0/edit#gid=2100307022

1
  • 1
    That is so weird. I created a new sheet and retried all settings and now it works, shrugs. Thanks!
    – Adam
    Commented May 27, 2023 at 13:52

Your Answer

By clicking “Post Your Answer”, you agree to our terms of service and acknowledge you have read our privacy policy.

Not the answer you're looking for? Browse other questions tagged or ask your own question.