The proposed solution for the general question has been already asked here: How to change the values of a pie chart to absolute values instead of percentages in Google Sheets
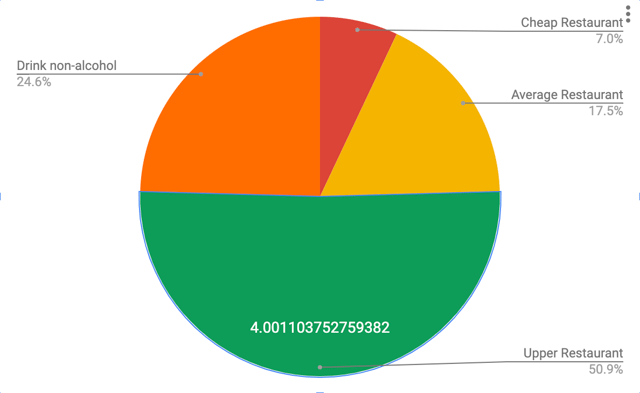
But it doesn't work for me because the value is only shown in 1 of the slices:
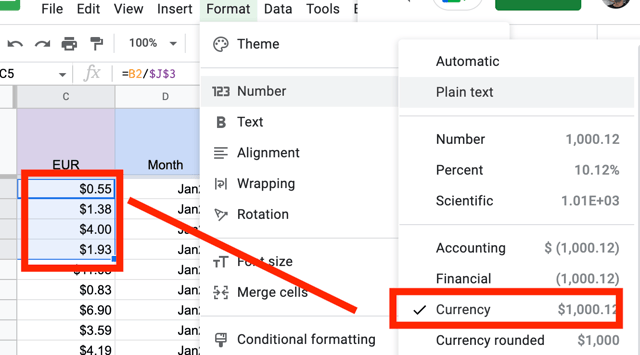
I thought that a solution may be to change the data to currency to show 2 decimals only, but it fixes nothing (the same is being shown):
I believe that's the only way to show the data on a Pie Chart currently:
Am I right? Is that the only why?
If so: how to show it in all slices when the number has decimals?


