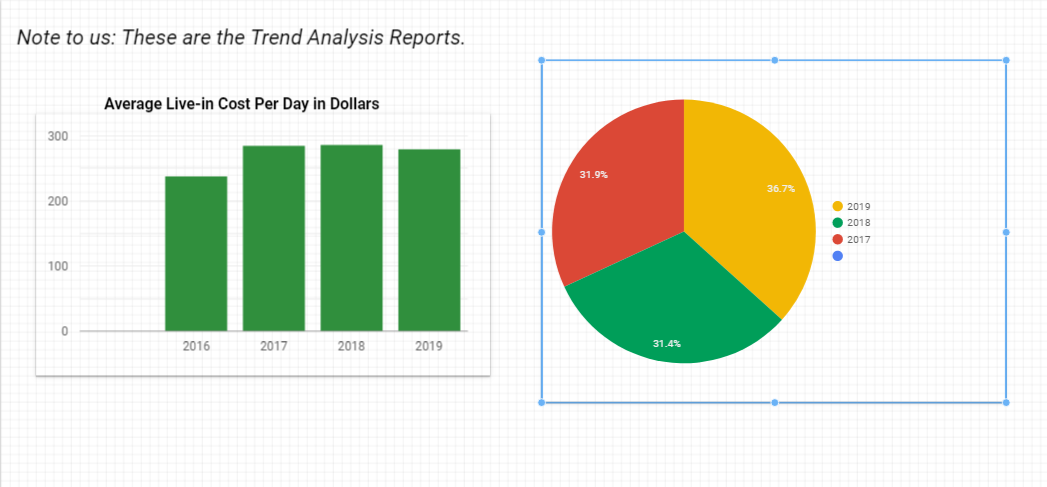
I have a simple Google Sheet for my source for Google Data Studio charts. Legends in pie charts and columns in bar charts show a "null" that I can't explain. My columns display correctly but there's always an empty column or "null" in the pie chart legend. Any ideas?

-
Maybe a dumb suggestion but did you tried croping the the cells to keep only data ? (no blank cells) I personnly like to use the Crop Sheet add-on and I have never encounter this problem using Data studio.– pjmgCommented Aug 28, 2019 at 19:10
-
Good thought but there are a LOT of columns in this project and the lengths vary. I'm not familiar with Crop Sheet but I'll look into it! Thanks!– Big Al MonroeCommented Aug 28, 2019 at 19:54
-
Did you check every field from the data source ? Sometimes it's because Data-studio use by default the wrong type of format. (Try to add some relevant screenshot in your question and blur or hide sensitive data)– pjmgCommented Aug 28, 2019 at 20:03
-
Yes, I've worked with that possibility. Sadly, I don't have permission in this forum, as a new member, to add a screenshot.– Big Al MonroeCommented Aug 28, 2019 at 20:11
-
1@BigAlMonroe you can upload to imgur and edit the post and add the link– Sathyajith BhatCommented Sep 4, 2019 at 12:51
|
Show 2 more comments
2 Answers
Add a "Chart Filter" in the "Data" panel. Click "+ Add a Filter" At the bottom, click "Create a Filter" First field, "Exclude" Second field, select your field. In this case I'm assuming "Month" Third field, "Is Null"
The reason why you see that null one(s) is because you select the whole column(s) as data source (ex. A:C) instead of only selecting the range with data (ex. A1: C20). You have 2 options:
- by selecting A:C, you have to add a filter in chart setup section to exclude those rows without data
- change the data source range to A1:C20 The 1st is better as it'll be able to handle the potential change of the data.
