0

I couldn't think of a better title, but here's what I have:

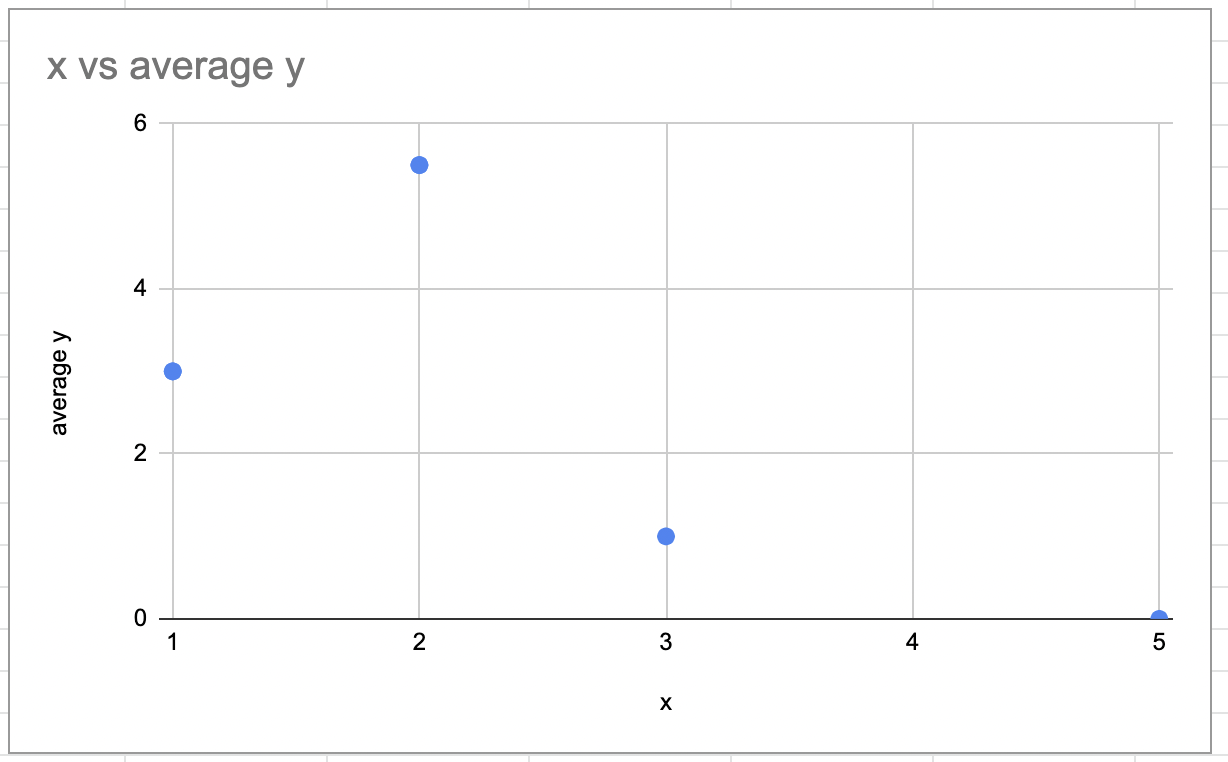
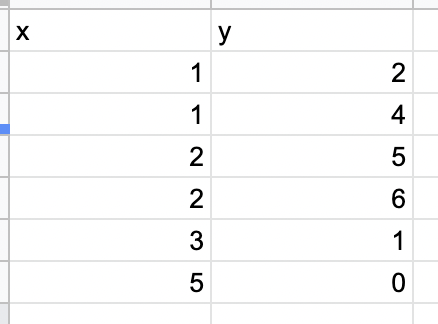
I want a graph of X and Y, but when there's multiple Y values for an X value, I want it to plot the average of the Y values.

Here's what I've tried:

I noticed that if I have two identical X,Y pairs, the graph will show them as a single point - so if I can create a column that averages out the Y values for the same X, I can graph that and get what I want (although I haven't been able to do that either).

1 Answer 1

0

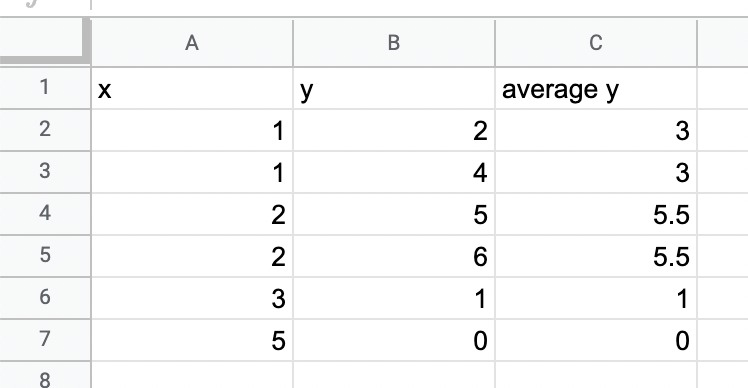
Create a new column called "Average Y"

In the first cell, use the following formula: =AVERAGEIF(A:A,A1,B:B)

Where A is your column of X values and B is your column of Y values.

In the same table as OP, result looks like:

enter image description here

And your resulting graph looks as expected (no duplicate points): enter image description here

Your Answer

By clicking “Post Your Answer”, you agree to our terms of service and acknowledge you have read our privacy policy.

Not the answer you're looking for? Browse other questions tagged or ask your own question.