Is there a way to plot 3D vector functions (also known as vector-valued functions) in Wolfram|Alpha?
I know it's possible to plot regular vectors, by typing in vector {2,5,3} for example, but I would like to be able to plot an equation like:
r(t) = <2t, cos(t)^2, t>
I've looked at the Wolfram Alpha documentation and haven't been able to find a way to do this. However, WA sometimes uses different terminology than I'm used to, so it's possible there's a way and I just don't know how to articulate it to WA.
Has anybody had any success doing this, or have any suggestions for how to figure it out?
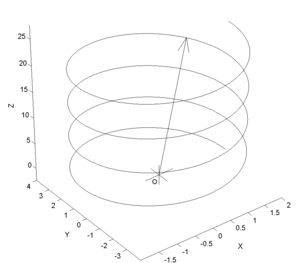
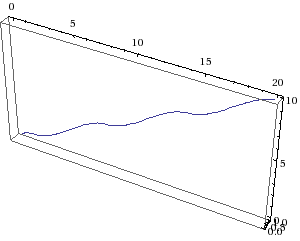
What I'm looking for is something like this:


