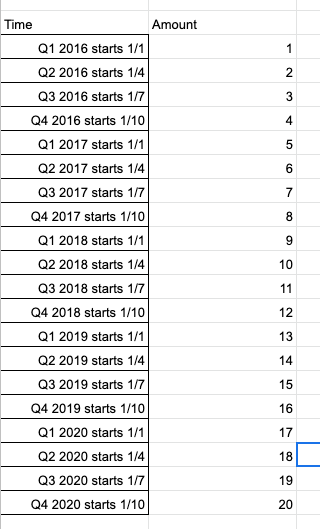
How to create a chart in Google Sheets for yearly value growth when the data is separated by quarters?
1 Answer
Year name
=mid(OFFSET(A$1,4*ROWS(A$1:A1)-4,,1),4,4)
Value
=SUM(OFFSET(B$1,4*ROWS(B$1:B1)-4,,4))
Enter these formula in cell D1 and E1 and copy down for as many years data exists.
Logic
Both formula rely on the OFFSET and ROWS functions.
OFFSETreturns a range referenceROWSreturns the number of rows in an range.
The Year value looks at Column A; it returns a single cell, every 4th entry, and MID extracts the year name.
The Annual value looks at Column B; it returns a range of four cells, and adds those values.
Credit: myonlinetraininghub.com


