2

I have a google form linked to a google sheet (so every time somenone fills the form, a new row is created). I would like to make a chart that count the number of rows each day. In the example shown below, I would like the first bar to have a height of 3, the second 6, then constant until 03/05/2020 where it goes to 16 and so on... Does anyone have a solution for this?

Thank you!

enter image description here

1 Answer 1

1

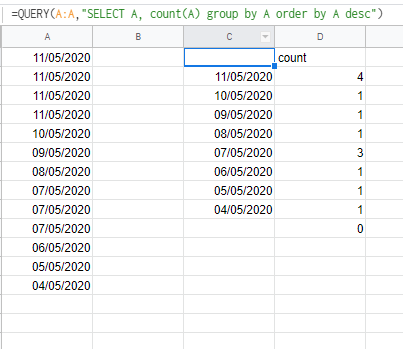
You can use a query like this :

=QUERY(A:A,"SELECT A, count(A) group by A order by A desc")

Result :

enter image description here

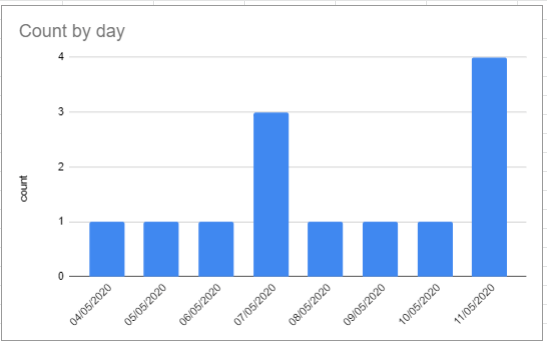
Graph :
enter image description here

1
  • Thank you very much! I simply added an extra column that counts the total entries to the considered day (simply by adding the day before and the current day). Thx again!
    – Naunau1999
    Commented May 13, 2020 at 20:04

Your Answer

By clicking “Post Your Answer”, you agree to our terms of service and acknowledge you have read our privacy policy.

Not the answer you're looking for? Browse other questions tagged or ask your own question.